Is Your Postgres Query Starved for Memory?

Like a patient with low blood pressure, a slow SQL
query might not be getting the memory it needs.
For years or even decades, I’ve heard about how important it is to optimize my SQL statements and database schema. When my application starts to slow down, I look for missing indexes; I look for unnecessary joins; I think about caching results with a materialized view.
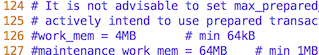
But instead, the problem might be my Postgres server was not installed and tuned properly. Buried inside the postgresql.conf file is an obscure, technical setting called work_mem. This controls how much “working memory” your Postgres server allocates for each sort or join operation. The default value for this is only 4MB:
If your application ever tries to sort or join more than four megabytes worth of data, this working memory buffer will fill up. Instead of just returning the dataset you want, Postgres will waste time streaming excess data out to disk - only to read it back again later as the hash join or sort algorithm proceeds.
Today I’ll start with a look at how Postgres scales up the hash join algorithm for larger and larger data sets. Then I’ll measure how much slower a hash join query is when the hash table doesn’t fit into the working memory buffer. You’ll learn how to use the EXPLAIN ANALYZE command to find out if your slow query is starved for memory.
Hash Tables Inside of Postgres
In my last article, I described how Postgres implements the hash join algorithm. I showed how Postgres scans over all the records in one of the tables from the join and saves them in a hash table.
Here’s what a hash table might look like conceptually:

On the left is an array of pointers called buckets. Each of these pointers is the head of a linked list, which I show on the right using blue rectangles. The rectangles represent values from one of the tables in the join. Postgres groups the values into lists based on their hash values. By organizing the values from one table like this, Postgres can later scan over a second table and repeatedly search the hash table to perform the join efficiently. This algorithm is known as a hash join.
Postgres’s hash join code gracefully scales up to process larger and larger data sets by increasing the number of buckets. If the target table had more records, Postgres would use 2048 buckets instead of 1024:

Before starting to execute the hash join algorithm, Postgres estimates how many records it will need to add to the hash table, using the query plan. Then Postgres chooses a bucket count large enough to fit all of the records.
Postgres’s bucket count formula keeps the average linked list length less than 10 (the constant NTUP_PER_BUCKET in the Postgres source code), to avoid iterating over long lists. It also sets the bucket count to a power of two, which allows Postgres to use C bitmask operations to assign buckets to hash values. The least significant bits of the hash value for each record becomes the bucket number.
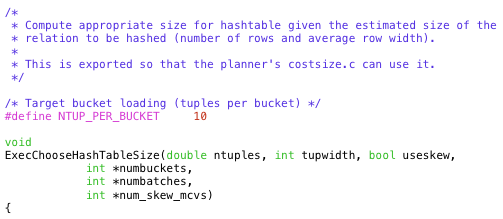
If you’re curious, Postgres implements the bucket count formula in a C function called ExecChooseHashTableSize.
How Large Can a Postgres Hash Table Grow?
If the table from your join query was even larger, then Postgres would use 4096 buckets instead of 2048:

In theory, this doubling of the bucket count could continue forever: 8192 buckets, 16384 buckets, etc. With 10 records per linked list, this would accommodate 81,920 values, 163,840 values, etc.
In practice, as the total size of the data set being saved into the hash table continues to increase Postgres will eventually run out of memory. But that doesn’t seem to be an immediate problem, does it? Modern server hardware contains tens or even hundreds of GBs - that is plenty of room to hold an extremely large hash table.
But in fact, Postgres limits the size of each hash table to only 4MB!

The rectangle I drew around the hash table above is the working memory buffer assigned to that table. Regardless of how much memory my server hardware actually has, Postgres won’t allow the hash table to consume more than 4MB. This value is the work_mem setting found in the postgresql.conf file.
At the same time Postgres calculates the number of buckets, it also calculates the total amount of memory it expects the hash table to consume. If this amount exceeds 4MB, Postgres divides the hash operation up into a series of batches:

In this example, Postgres calculated that it would need up to 8MB to hold the hash table. A larger join query might have many more batches, each holding 4MB of data. Like the bucket count, Postgres sets the batch count to a power of two also. The first batch, shown on the left, contains the actual hash table in memory. The second batch, shown on the right, contains the records that won’t fit into the 4MB hash table in the first batch. Postgres assigns a batch number to each record, along with the bucket number. Then it saves the records from the first batch into the hash table, and streams the remaining data out to disk. Each batch gets its own temporary file.
Using an algorithm known as the Hybrid hash join, Postgres first searches the hash table already in memory. Then it streams all of the data back from disk for the next batch, builds another hash table and searches it, repeating this process for each batch.
Note: Postgres actually holds a second hash table in memory, called the skew table. For simplicity I’m not showing this in the diagram. This special hash table is an optimization to handle hash values that occur frequently in the data. Postgres saves the skew table inside the same 4MB working memory buffer, so the primary hash table actually has a bit less than 4MB available to it.
Measuring Your SQL Statement’s Blood Pressure
If one of the SQL queries in your application is running slowly, use the EXPLAIN ANALYZE to find out what’s going on:
> explain analyze select title, company from publications, authors where author = name;

                                                          QUERY PLAN
-------------------------------------------------------------------------------------------------------------------------------
 Hash Join  (cost=2579.00..53605.00 rows=50000 width=72) (actual time=66.820..959.794 rows=21 loops=1)
   Hash Cond: ((authors.name)::text = (publications.author)::text)
   ->  Seq Scan on authors  (cost=0.00..20310.00 rows=1000000 width=50) (actual time=0.059..267.217 rows=1000000 loops=1)
   ->  Hash  (cost=1270.00..1270.00 rows=50000 width=88) (actual time=38.054..38.054 rows=50000 loops=1)
         Buckets: 4096  Batches: 2  Memory Usage: 2948kB
         ->  Seq Scan on publications  (cost=0.00..1270.00 rows=50000 width=88) (actual time=0.010..14.211 rows=50000 loops=1)
 Planning time: 0.489 ms
 Execution time: 960.482 ms
(8 rows)
Postgres’s EXPLAIN command displays the query plan, a tree data structure containing instructions that Postgres follows when it executes the query. By using EXPLAIN ANALYZE we ask Postgres to execute the query also, displaying time and data metrics when its finished. We can see in this example there were one million records in the authors table and 50 thousand records in the publications table. At the bottom we see that the join operation took a total of 960ms to finish.
EXPLAIN ANALYZE also tells us how many buckets and batches the hash table used:
Buckets: 4096 Batches: 2 Memory Usage: 2948kB
Like my diagram above, this query used 2 batches: Only half of the data fit into the 4MB working memory buffer! Postgres saved the other half of the data in the file buffer.
Increasing work_mem
Now let’s increase the size of the working memory buffer by editing the postgresql.conf file and restarting the Postgres server.
First, I stop my Postgres server:
$ launchctl unload homebrew.mxcl.postgresql.plist
Then I edit postgresql.conf:
$ vim /usr/local/var/postgres/postgresql.conf
…uncommenting and changing the setting:
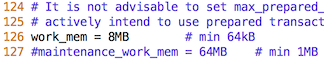
Finally I restart my server and repeat the test:
$ launchctl load homebrew.mxcl.postgresql.plist
> explain analyze select title, company from publications, authors where author = name;
                                                          QUERY PLAN
-------------------------------------------------------------------------------------------------------------------------------
 Hash Join  (cost=1895.00..32705.00 rows=50000 width=72) (actual time=59.224..624.716 rows=21 loops=1)
   Hash Cond: ((authors.name)::text = (publications.author)::text)
   ->  Seq Scan on authors  (cost=0.00..20310.00 rows=1000000 width=50) (actual time=0.031..146.327 rows=1000000 loops=1)
   ->  Hash  (cost=1270.00..1270.00 rows=50000 width=88) (actual time=34.436..34.436 rows=50000 loops=1)
         Buckets: 8192  Batches: 1  Memory Usage: 5860kB
         ->  Seq Scan on publications  (cost=0.00..1270.00 rows=50000 width=88) (actual time=0.008..13.382 rows=50000 loops=1)
 Planning time: 0.481 ms
 Execution time: 625.796 ms
(8 rows)
You can see the number of batches is now 1, and the memory usage increased to 5.8MB:
Buckets: 8192 Batches: 1 Memory Usage: 5860kB
Postgres was able to use a working memory buffer size larger than 4MB. This allowed it to save the entire data set into a single, in memory hash table and avoid using temporary buffer files.
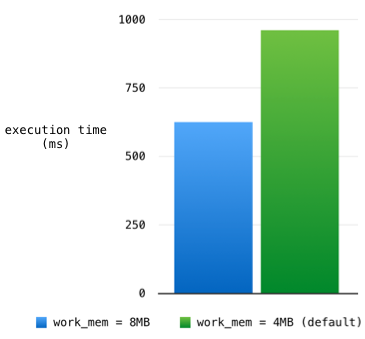
Because of this, the total execution time decreased from 960ms to 625ms:
Too Good To Be True
If memory intensive Postgres SQL statements could run so much faster, why does Postgres use only 4MB by default for the working memory buffer size? In this example I increased work_mem modestly from 4MB to 8MB - why not increase it to 1GB or 10GB? Why not use all of your server’s available memory to run all of your SQL statements as fast as possible, all of the time? That’s why you bought that fat box to host your Postgres server, isn’t it?
This result seems too easy, too good to be true. And it is.
Database servers like Postgres are optimized to handle many small, concurrent requests at the same time. Each request needs its own working memory buffer. Not only that, each SQL statement Postgres executes might require multiple memory buffers, one for each join or sort operation the query plan calls for.

My Postgres server isn’t entirely dedicated to executing this one example SQL statement and nothing else. By increasing the value of work_mem, I’ve increased it server-wide for every request, not just for my one slow hash join. Given the same amount of total RAM available on the server box, increasing work_mem means Postgres can handle fewer concurrent requests before running out of memory.
However, it certainly might be the case that 8MB or some larger value for work_mem is appropriate given the amount of memory I have, and the number of concurrent connections I expect.
Be smart about how you configure your Postgres server. Don’t blindly accept the default values, or guess what they should be at the moment you install Postgres. Instead, after your application is finished and running in production, look for memory intensive SQL statements. Measure the SQL queries your application actually executes. Take their blood pressure using the EXPLAIN ANALYZE command; you might find they are memory starved!