Bundler’s Best Kept Secret
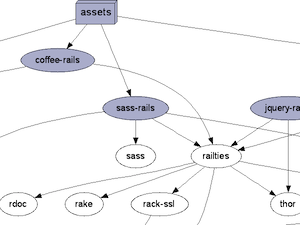 |
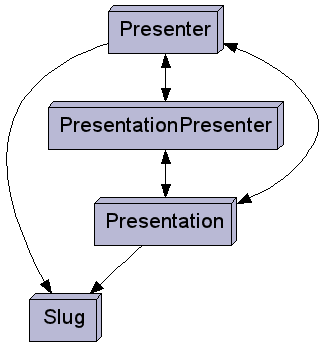
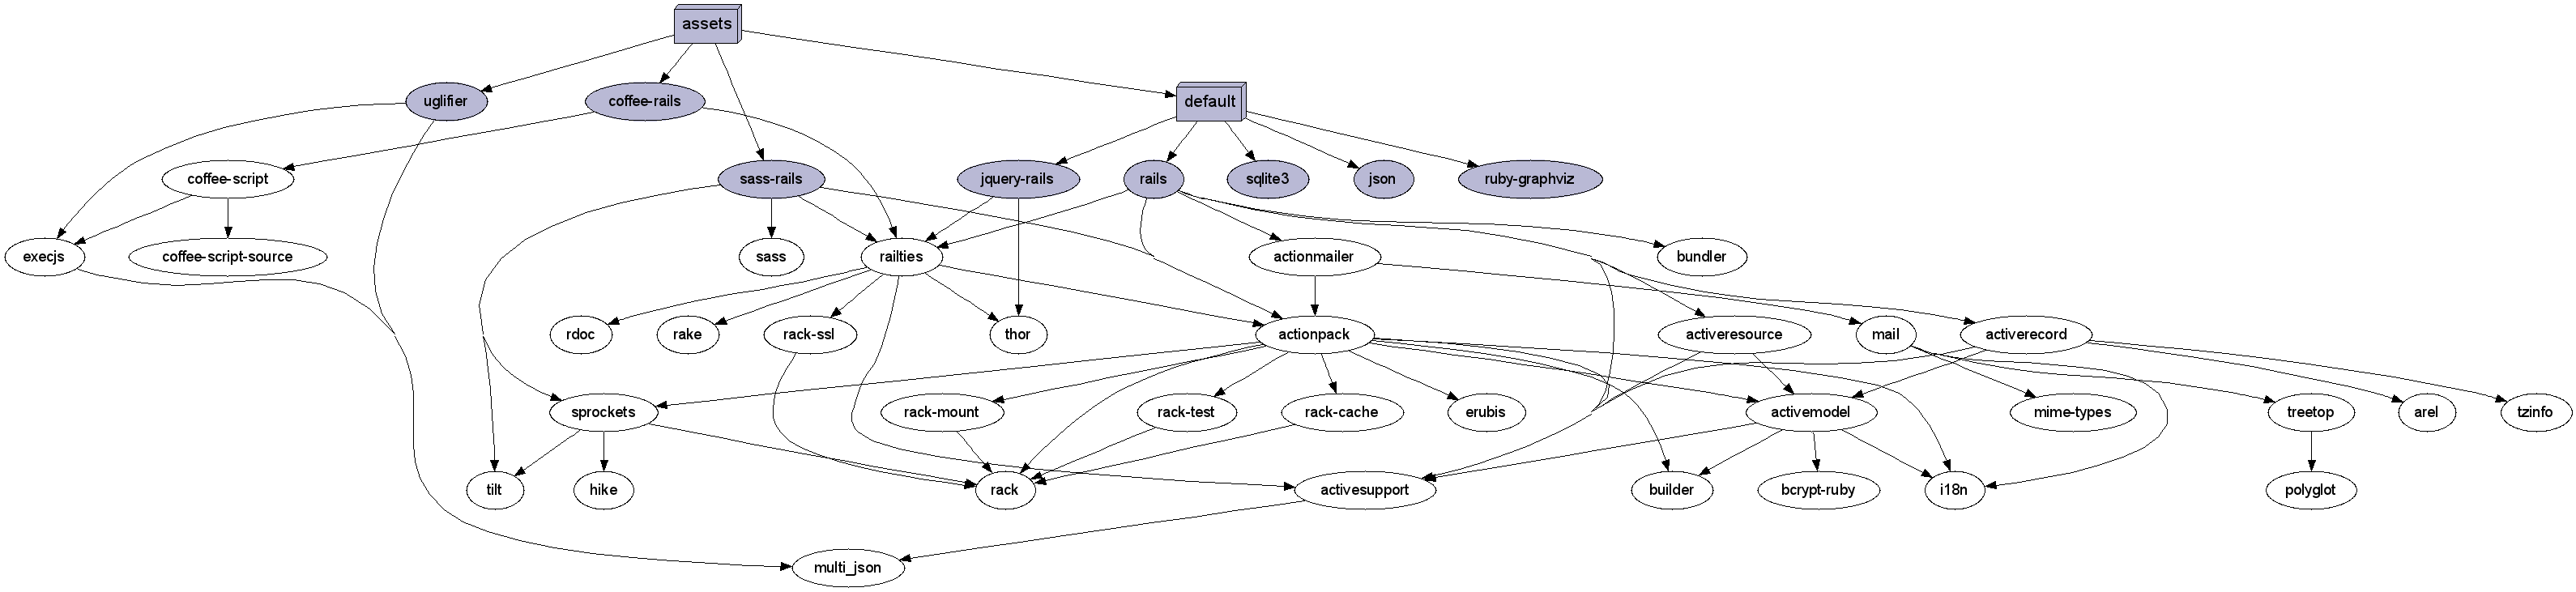
| Part of a gem dependency network graph |
This week I just discovered Bundler’s best kept secret: the bundle viz command will generate a network graph showing the dependencies among all the different gems used by your Ruby app. For example, the image on the left is a portion of the gem dependency graph for a vanilla Rails 3.1 app. Click here to see the entire, uncropped dependency graph. The gems actually called out in your Gemfile are displayed in grey, while other gems included through dependencies only are shown in white. Finally gem groups are shown as rectangles along the top.
To try this on your own app, you’ll first need to install the GraphViz library, which is what Bundler uses to generate the graph. On my Mac Lion laptop, I used Homebrew:
$ brew install graphviz
You can also install it with Macports, and on the GraphViz web site there are executable binaries available for the Linux, Mac SnowLeopard and Leopard and also Windows platforms. Once you have the GraphViz library installed, you’ll also need to install the ruby-graphviz gem (or add it to your Gemfile):
$ gem install ruby-graphviz
Then you can go ahead and run:
$ bundle viz
/Users/pat/apps/path/to/my_app/gem_graph.png
... and it will display the path to a new “gem_graph.png” file. Open this up and you’ll see your gem dependency network graph; very cool! There are also options to include each gem's version number (--version) or dependency requirements (--requirements) in the chart:
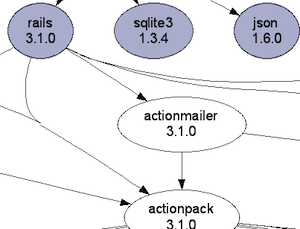 |
| bundle viz --version |
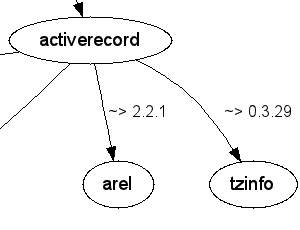 |
| bundle viz --requirements |
Example: Displaying ActiveRecord associations with GraphViz
Using the ruby-graphviz gem from Ruby is actually quite easy, and you can use the Bundler source code in graph.rb as a working example to learn from.
First you need to create a new GraphViz object like this:
graph_viz = GraphViz::new('Gemfile', {:concentrate => true, :normalize => true, :nodesep => 0.55})
graph_viz.edge[:fontname] = graph_viz.node[:fontname] = 'Arial, Helvetica, SansSerif'
graph_viz.edge[:fontsize] = 12
These are the options that Bundler uses for the font, font size and other layout attributes; you can take a look at the documentation on the GraphViz site to learn about all of the other options available.
As an example today, we can display nodes for all of the ActiveRecord models in your Rails app using code like this:
models = {}
each_model do |model|
  name = model.to_s
  models[name] = graph_viz.add_node(name, { :shape => 'box3d',
                                            :fontsize => 16,
                                            :style => 'filled',
                                            :fillcolor => '#B9B9D5' } )
end
Here I’m calling graph_viz.add_node for each model, and then saving the nodes in a hash called “models.” The each_model method will look like this:
def each_model
  ObjectSpace.each_object(Class) do |klass|
    yield klass if klass.ancestors.include?(ActiveRecord::Base) && klass != ActiveRecord::Base
  end
end
This just iterates over all of the Ruby classes loaded in the system, and yields just those that are subclasses of ActiveRecord::Base. To try this code yourself, you’ll have to run with RAILS_ENV=production to force Rails to preload all of the model classes.
Once you have the nodes on the chart, the next step is to draw the lines between them using the add_edge method. Looking in graph.rb you can see how Bundler calls add_edge for each gem’s dependencies. For our ActiveRecord associations example, we’ll use code like this:
each_model do |model|
  model_name = model.to_s
  model.reflect_on_all_associations.each do |assoc|
    assoc_name = assoc.name.to_s.singularize.camelize
    graph_viz.add_edge(models[model_name],
                       models[assoc_name],
                       { :weight => 2 }
                      ) unless models[assoc_name].nil?
  end
end
This uses the reflect_on_all_associations method to find all of the associations for the given model, and then passes in the source and destination nodes after looking them up in the models hash.
Finally, we just ask GraphViz to generate the network graph and save it into an image file like this:
graph_viz.output( :png => 'activerecord_associations.png' )
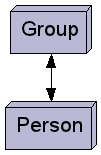
For a simple has_many/belongs_to assocation like this:
class Group < ActiveRecord::Base
  has_many :people
end

class Person < ActiveRecord::Base
  belongs_to :group
end
...you’ll get a network graph that looks like this:
Here’s a more real world example - this is the network graph I get for the ActiveRecord associations in the BostonRB web site http://bostonrb.org:

